Restoration is super cool... literally!
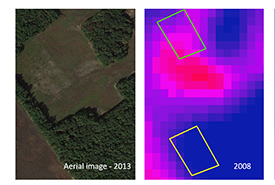
Left: An image of a restored field on an NCC property in 2013. Right: A thermal image of the same field taken in 2008. (Images by Google Earth and USGS Landsat 5)
Restoration of woodland begins with site preparation and seeding, but monitoring is needed after that to make sure the restoration stays on track for the next 40 plus years. This blog post explains the application of thermodynamic theory to the monitoring of restoration sites.
Just as humans need check-ups after big operations to make sure recovery is going well, ecosystems undergoing restoration also need to be monitored. Monitoring allows us to identify and fix threats to an ecosystem, such as disease, plant die-offs, human impacts and invasive species, before they become too big of an issue.
However, monitoring restoration on the ground is tricky, expensive and time-consuming. Areas to be monitored are large, sometimes difficult to travel through and full of countless species to keep track of. It can literally be hard to see the diseased part the forest for all the trees or invasive insect outbreaks in tall grass prairie because of the two-metre-tall grass. For these reasons, my research involves using satellite imagery and applying thermodynamic theory to monitor restoration from above. Similar to how doctors take their patients' temperatures to help them find out what's going on within them internally, taking the temperatures of ecosystems can tell us something about their health beyond what is visible at the surface.
Related blog posts
According to thermodynamic theory, the more an ecosystem matures, the better it becomes at absorbing the sun’s incoming energy, reflecting less of it back into space as heat. As a result, the ecosystem appears colder during the day. Ecosystems become better at absorbing energy by increasing photosynthesis and transpiration (carbon dioxide release). This is not just an effect of increased numbers of plants and leaf area but also due to a rise in the different types of organisms that can break down, store and cycle energy and nutrients.
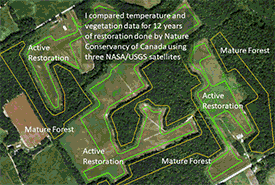
Comparing the temperatures to vegetation data recorded by NCC staff over the last 12 years. (Image by Jonas Hamberg)
On a warm and sunny summer day in Norfolk County, Ontario, the more mature ecosystems should show up as colder in thermal images than the less mature ecoystems. I am using thermal imagery from satellites to test if this is true by comparing the temperatures to vegetation data recorded by NCC staff over the last 12 years.
I’m hoping to take this work forward and create a tool for restoration managers, including those working at NCC, to be used as an early detection system for restoration progress. While a temperature spike may indicate that something is going wrong, going out in the field is still required to actually diagnose what is going on and fix it. More on that to come!
The Nature Conservancy of Canada (NCC) has restored over 650 hectares of land in Norfolk County, Ontario since 2007, with a goal to create a mixture of woodland, tall grass prairie and wetland habitat.
About the Author
Jonas Hamberg is a Ph.D. candidate in the Conservation and Restoration Ecology (CaRE) lab at the University of Waterloo.
