What a difference a year makes
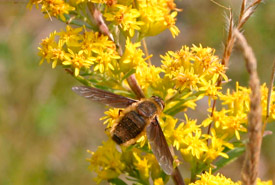
The summer-blooming showy goldenrod, being visited by a bee fly, was less abundant than the spring-blooming flowers. (Photo by Diana Robson)
One of the first papers on pollination I tried to publish was rejected because it contained data from only one field season. I withdrew the paper, and did another year of research. Why is having two years of data so important, you may ask? It’s mainly because the world is a messy, and often inconsistent, place.
This year, I conducted a second year of pollinator surveys at the Nature Conservancy of Canada's (NCC's) Yellow Quill Prairie Preserve in Manitoba. One thing I learned was that the flowering season starts much earlier than I had anticipated when I first started my research. Initially, I thought August would be the month with the most flowers blooming, but now I know that May has more due to the abundance of common chickweed and three-flowered avens — both of which bloom in that month. Further, there were several plants that I didn’t think were particularly attractive to pollinators.
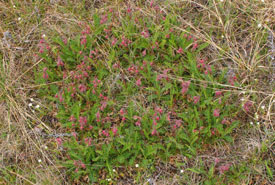
Common chickweed and three-flowered avens were abundant in May at Yellow Quill Prairie Preserve. (Photo by Diana Robson)
In 2016, during my first few visits to the property, I observed only a few pollinators visiting the blanket flowers and concluded that it was probably an unimportant plant. However, in 2017, I observed this plant at peak bloom and, after averaging the data, discovered that it was actually one of the most frequently visited plants. Without two years’ worth of data, the importance of some species would have been underestimated.
When looking at data, it’s important to understand what the word “average” really means. It can be a bit misleading because it implies that most things are the same. In fact, it could mean that things are usually different. Take something like the number of times pollinators visit a group of plants. If I say the average number of visits per hour is 18, you would think that means you would typically see three visits, every 10 minutes, all summer long. But that’s not what happens at all.
On cool, windy days, I sometimes saw less than one visit per hour. On warm days, however, 25 to 50 visits an hour was typical. So the average is actually the number in between these extremes, and not really representative of what you would see on any given day. Only by collecting lots of data over long periods of time can you really get a good idea of what’s going on in an ecosystem.
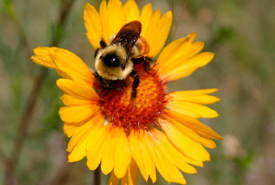
I finally saw bumblebees visiting blanket flowers in 2017. (Photo by Diana Robson)
Why do we see such extreme fluctuations in nature? Certainly the weather, time of year, land usage and life cycles affect plants and pollinators, but there are also other factors that we don’t entirely understand. In fact, ecologists rarely expect to find a reason for all of the variability they observe in a system.
Long-term and multi-year studies are valuable because they help us see beyond the noise of the data. An accurate picture of how ecosystems work and might adapt to environmental changes cannot be assessed without this type of research.
This research is made possible by funding from the Nature Conservancy of Canada and the Manitoba Museum Foundation.
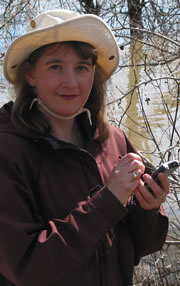
About the Author
Diana Bizecki Robson is the curator of botany at The Manitoba Museum.
